0

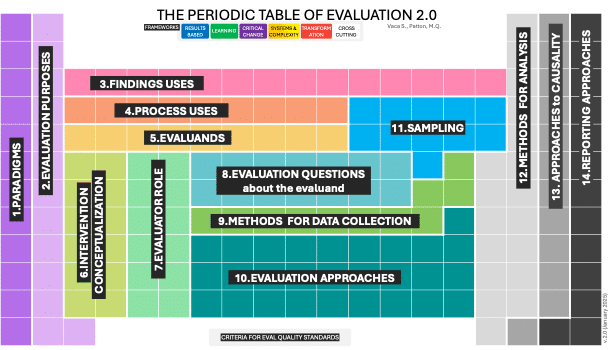
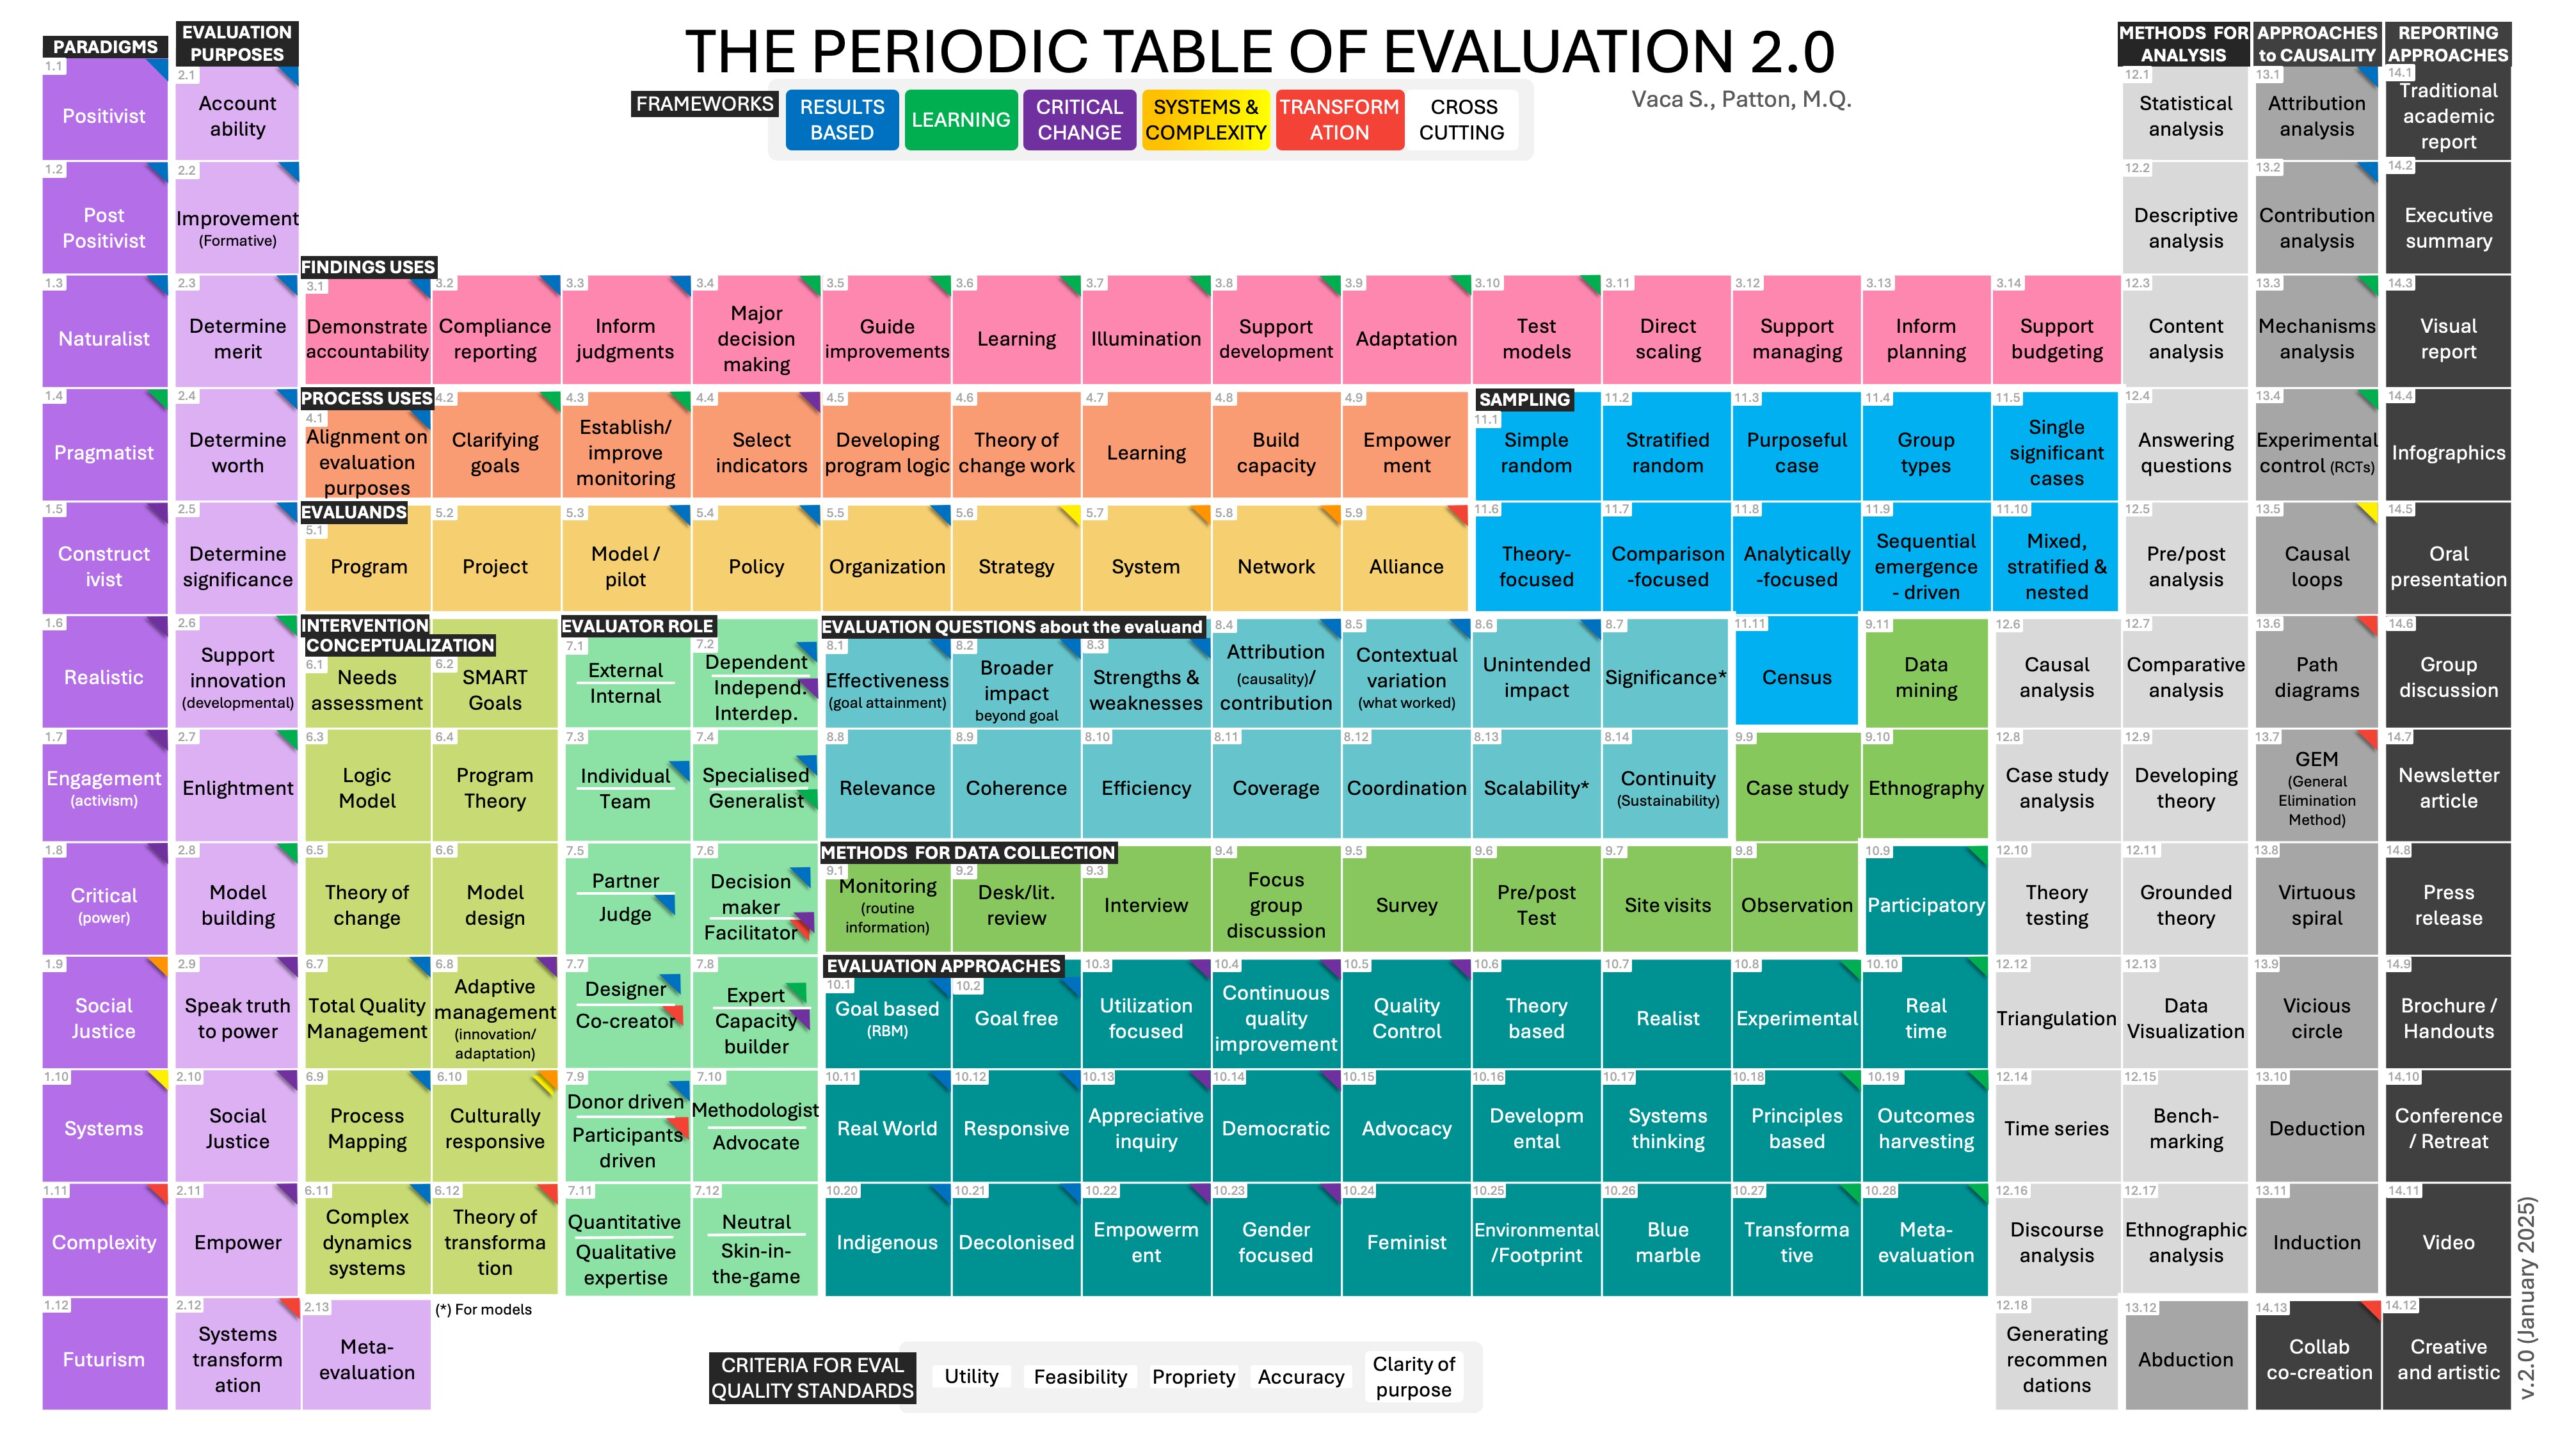
La Tabla Periódica de Evaluación 2.0 (2025)

Michael Q. Patton and Sara Vaca have embarked on an exciting journey to curate and assemble what we now present as the Periodic Table of Evaluation Elements 2.0. Their goal was to provide a comprehensive and navigable overview of the evaluation field, helping practitioners and enthusiasts alike make sense of its complexity and diversity.
Esta Tabla Periódica de Evaluación es tanto un reflejo del estado actual del campo como una invitación a participar en su evolución continua, y reconoce que puede no ser exhaustiva. Pretende servir de:
  • Un recurso para el aprendizaje y la inspiración.
  • Una herramienta para la enseñanza y la reflexión.
  • Un marco para reflexionar sobre la evaluación de forma holística.
The table is organized into 14 categories, encompassing a total of 188 elements, complemented by 6 perspectives and 4 quality standards (198 elements in total). These components represent the building blocks of evaluation, capturing its diverse methodologies, approaches, tools, and frameworks. Each category highlights a specific dimension of evaluation, from foundational principles to cutting-edge innovations. Together, they offer a holistic view of what it means to evaluate effectively and thoughtfully in today’s dynamic world.

La Tabla Periódica de Evaluación 2.0 (2025)

0 €

A la gente le gusta lo visual y la claridad...

Discover what they say about us…

Cheryl Abraham
Cheryl Abraham
★★★★★
Clarity Architect | Cybersecurity Strategist
"Being part of the 'Loving Clarity' mentorship program was a really positive experience, and I sincerely appreciate your very helpful guidance. The program's setup and content were quickly beneficial. I picked up several practical strategies that have made my work products noticeably more useful for the audience. Your accommodating style made the whole process smooth and enjoyable".
Bianca Tejada
Bianca Tejada
★★★★★
Project Management - Data Analysis
"The ToC course is excellent. It provides a practical, hands-on approach to developing a Theory of Change visually and offers actionable tips for facilitating sessions with project teams. Thanks to this course, I had the opportunity to facilitate two Theory of Change sessions with teams from two different countries. I highly recommend it".
Michael Q. Patton
Michael Q. Patton
★★★★★
Founder and CEO of Utilization-Focused Evaluation
"Clearly this is the era of visual communication, whether you are communicating a model, findings, or an approach. And Sara Vaca is my expert and go-to resource."
Elba Estrada
Elba Estrada
★★★★★
Project Manager
"Sara Vaca no sólo transmite su pasión por la visualización de datos desde el primer momento, sino que consigue convencerte de la necesidad de incorporar esta técnica a la evaluación. Para personas como yo, que trabajamos en JEEs, Sara es un modelo a seguir gracias a su clara apuesta por la innovación. Además, su motivación y dinamismo son realmente inspiradores".
Jean-Marc Bertolino
Jean-Marc Bertolino
★★★★★
Expert in New Economic Models
"I work in a complex and challenging consulting field, often obscured by abstruse jargon. For a long time, I struggled with the challenge of simplifying, popularizing, and pitching it. Sara made processes and methods clear and accessible with a disconcerting visual fluidity. Since then, I have been able to communicate much more effectively in my presentations and business proposals."
Catalogue customers
Catalogue customers
★★★★★
Several people who have bought the Catalogue
- Love your work and your visualisations - evaluation finally makes sense to me! - I use your visuals every time I want to design a ToR for an evaluation!

Acerca de Sara Vaca

Sara Vaca es una experta en visualización de datos apasionada por la enseñanza. Sus cursos están diseñados para ayudar a los estudiantes a dominar el arte de la visualización de datos y comunicar la información de manera eficaz.